
Revenue, AR aging, drivers and lanes,
on one Reports page.
The Reports page in the RushHour Company Portal holds 18 built-in reports on revenue, receivables, operations, sales, pricing and costs. Pick a report, set the dates or options, run it and export the rows to CSV, without opening the AI assistant. Admins choose which roles can open the page, and the money reports also follow each role's invoice and expense access.
Inside the Reports page
18 reports in six areas
Reports sits in the Company Portal sidebar, between Documents and Accounting. It runs 18 of the 44 reports the AI assistant runs on request, each with its own form and CSV export.
Revenue and receivables
Billed revenue, AR aging and orders never invoiced
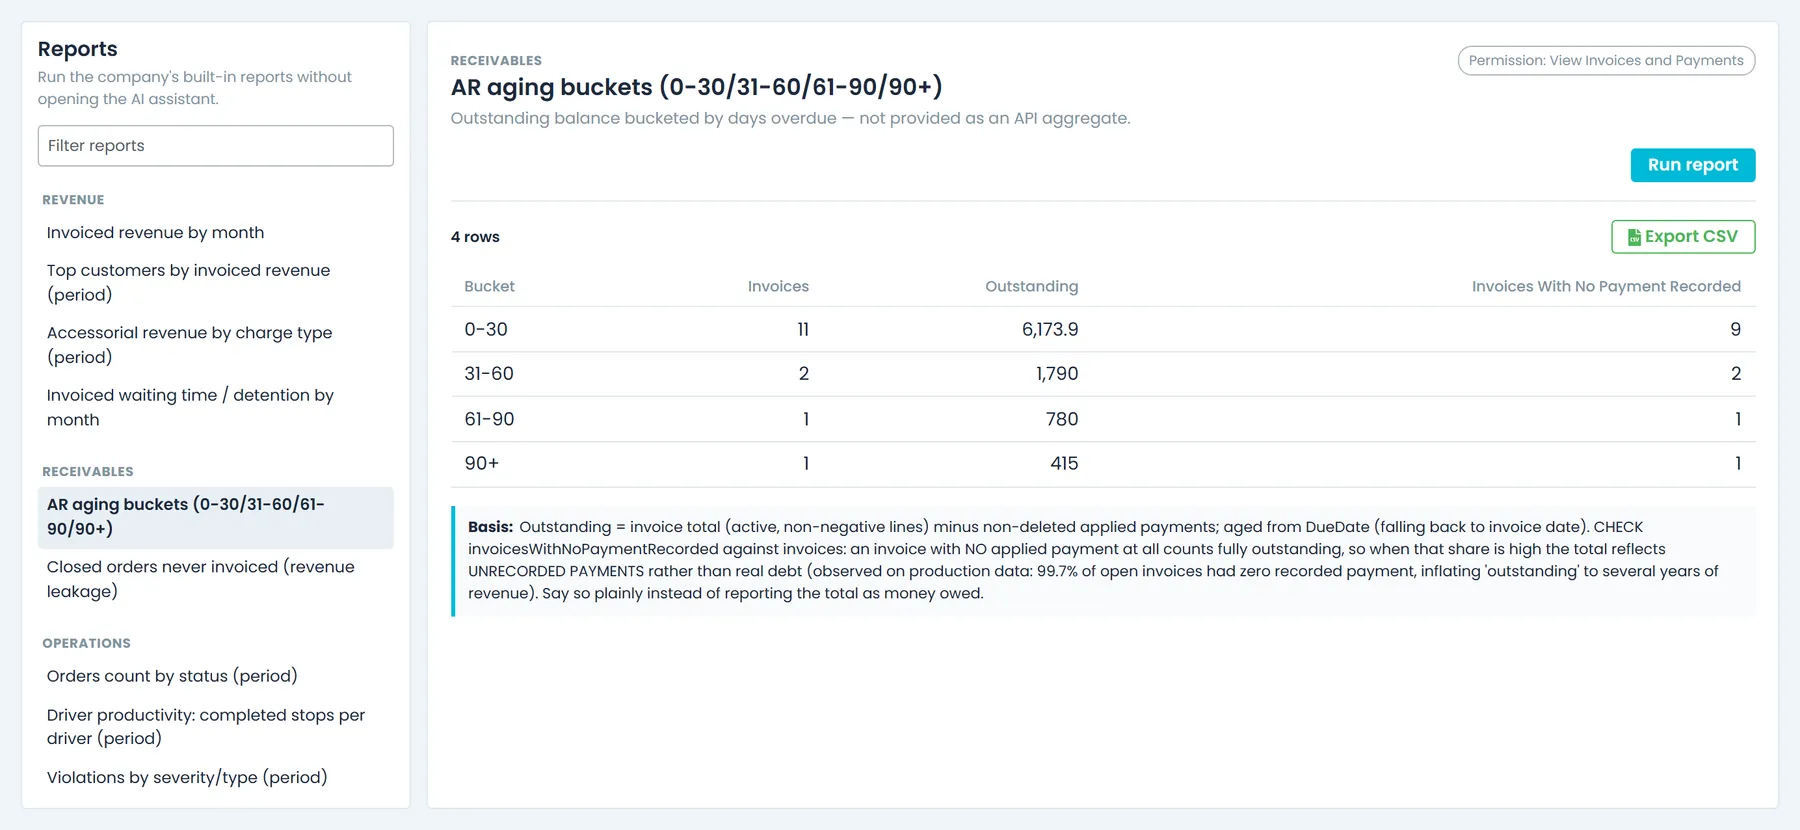
Revenue has four reports: invoiced revenue by month, top customers by invoiced revenue, accessorial revenue by charge type, and invoiced waiting time and detention by month. Receivables has two: AR aging in 0-30, 31-60, 61-90 and 90+ day buckets, and closed orders never invoiced, with their freight price.
- Invoiced revenue from the same invoices as the Dashboard, with credit lines netted in
- Credits listed apart from billed accessorials and detention
- Closed orders never invoiced, month by month
- AR aging counts how many open invoices have no payment recorded at all
Operations and sales
Orders, driver output and new business
Operations covers orders counted by status and completed stops per driver. Sales covers new customers added per month, an estimate of quote-to-order conversion by month, and average order value by shipment type. Users who can open the Hours of Service board or the driver Issues page also find links to them in the same list; the Hours of Service link appears when Hours of Service is turned on in Settings > Driver App.
- Completed stops per driver for the dates you pick
- Quote-to-order conversion estimate by month
- Average order value per shipment type, freight charge only
Pricing and costs
Lane prices, custom prices and costs
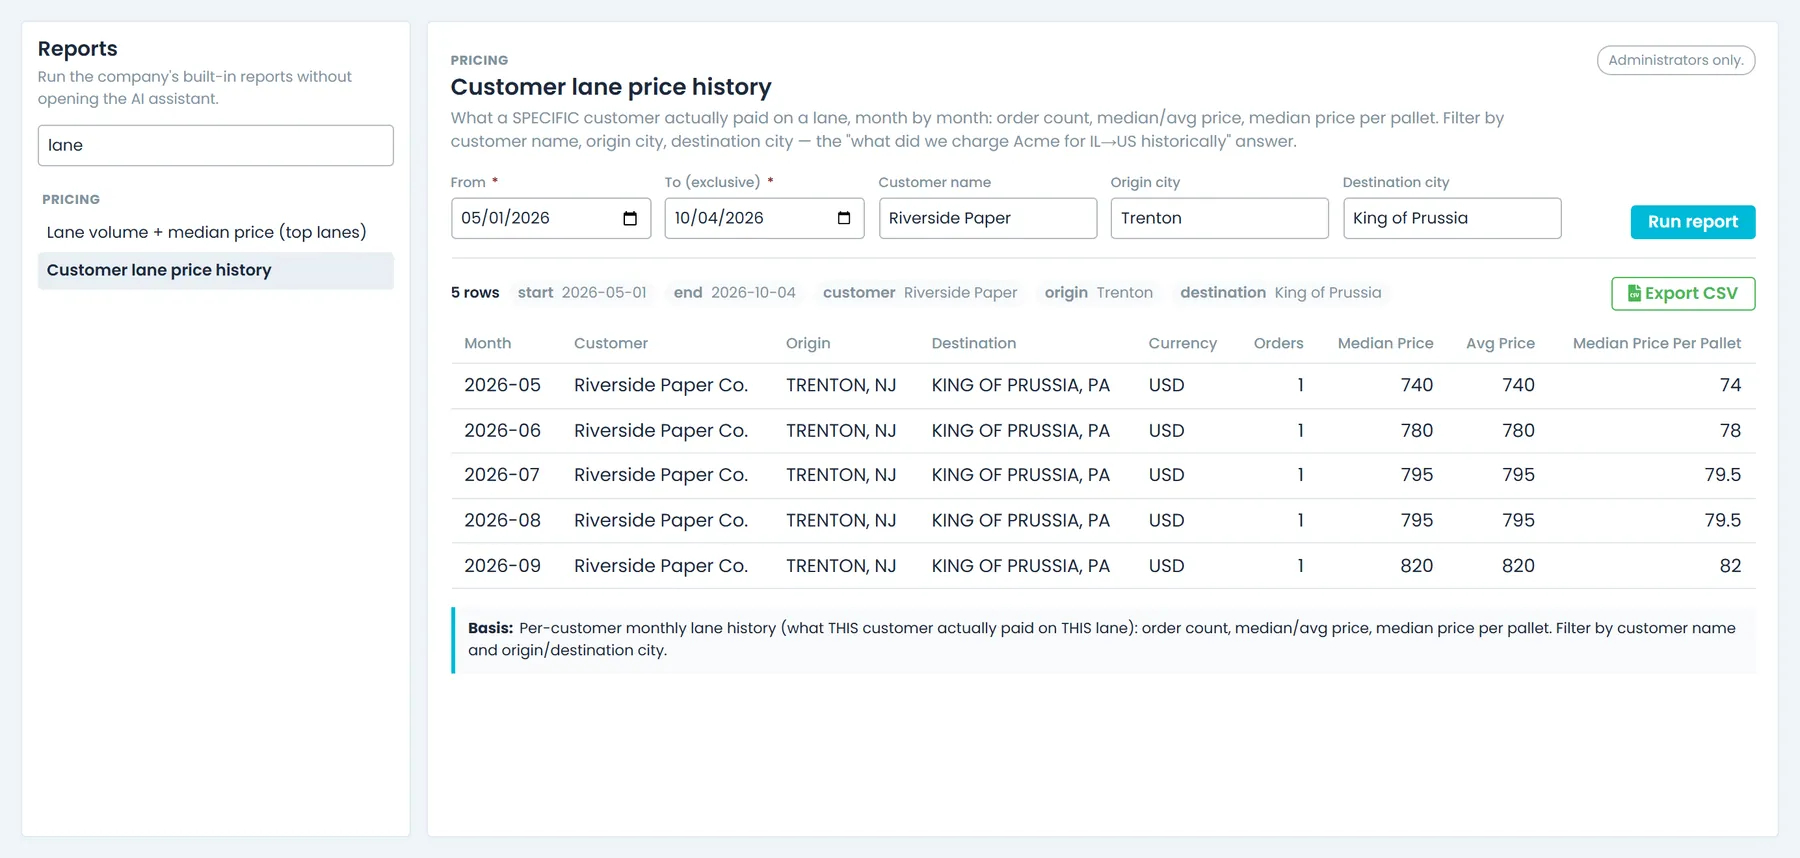
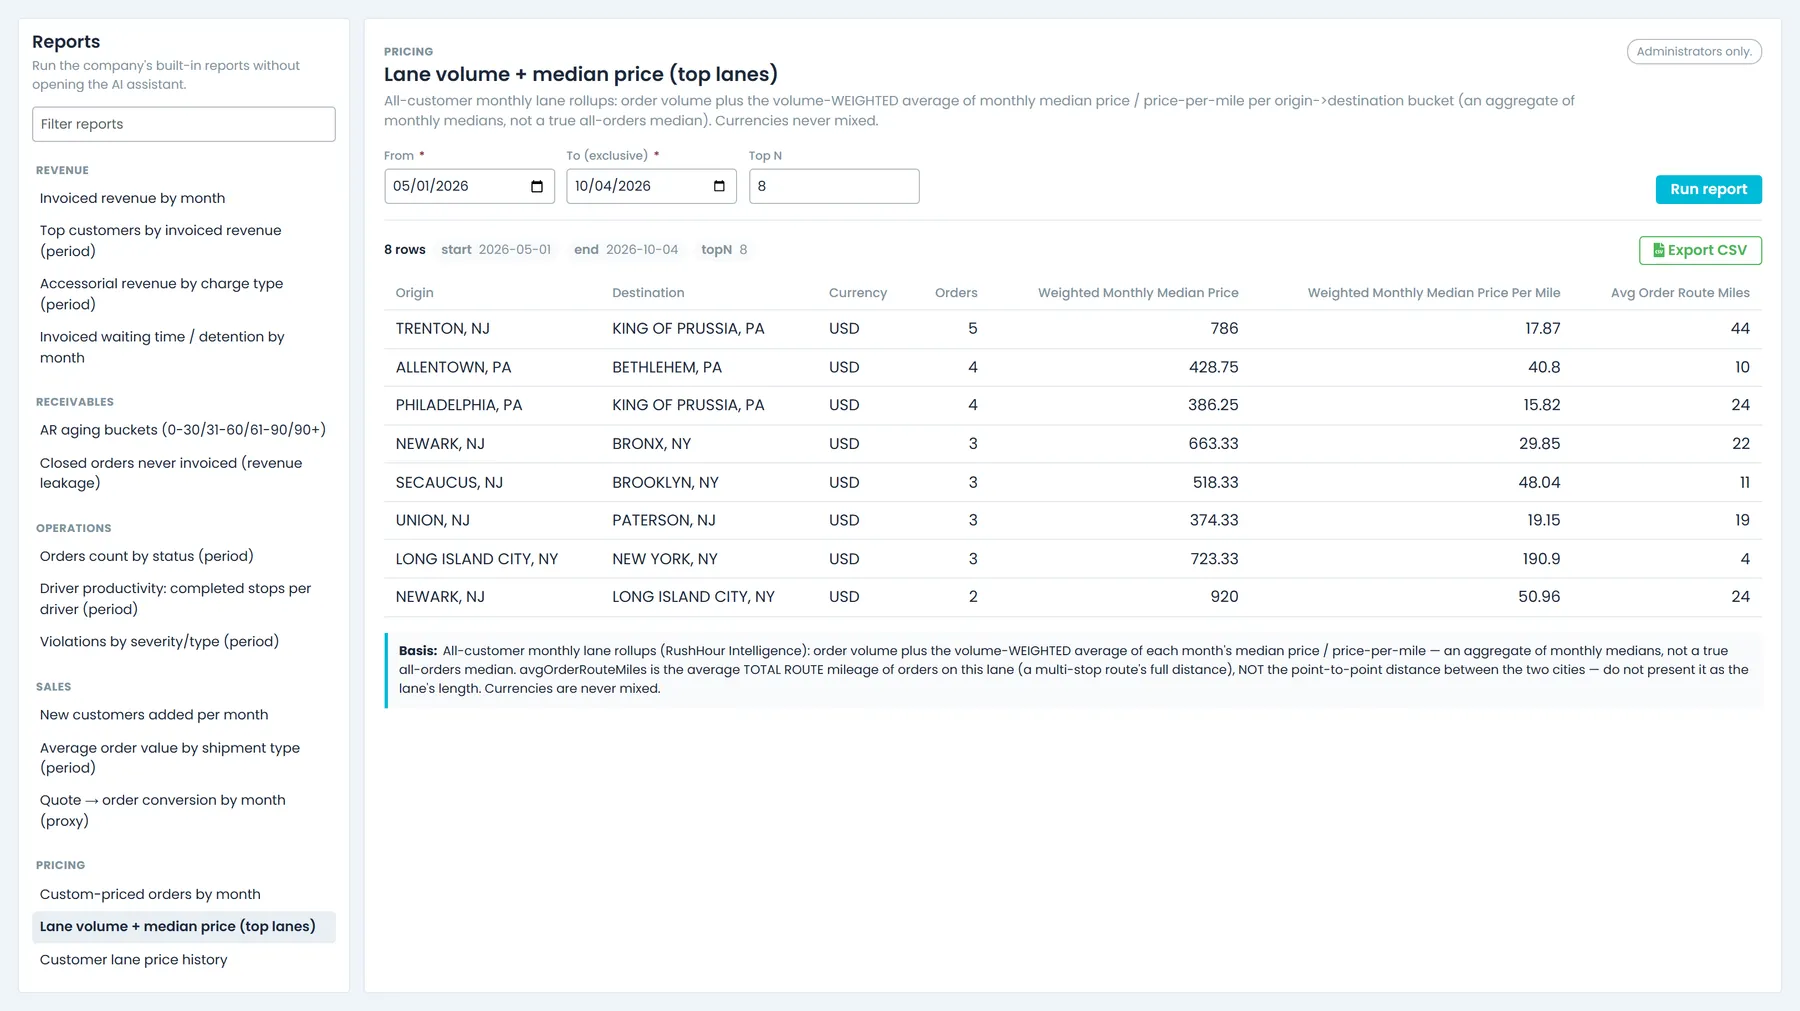
Pricing covers custom-priced orders by month, your top lanes by order volume with their weighted monthly median price and price per mile, and one customer's lane price history, which you can filter by customer name and origin and destination city. Costs covers expense totals by type and subtype, order prices beside their cost lines by month, and the route payouts recorded for drivers and outsource carriers, grouped by payment status. The price vs cost report also says whether those cost lines are real costs or rate-card prices.
- What one customer paid on a lane, month by month
- Top lanes by volume, with the weighted monthly median price and price per mile
- Orders given a custom price, counted per month
- Lane figures stay in their own currency and are never mixed
Run and export
Pick a report, set the options, export the rows
Each report opens with its own form, and most take From and To dates that default to the current calendar year. The two ranked reports add a Top N count from 1 to 100, set to 10 until you change it, and the customer lane history adds customer and city filters. The form checks the values before it runs. Results show as a table with a note on what the numbers are based on, and Export CSV saves the rows to a file named after the report and its dates.
- Filter the list to find a report by name
- Bookmark a report's link to rerun it with the same options
- CSV that opens in Excel, Hebrew text included
- Open Reports from the sidebar or from Ctrl/Cmd+K search
Read the numbers right
A Basis note under every result, and limits that are stated
Every result ends with the report's Basis note, shown word for word. The AR aging note, for example, begins: "Outstanding = invoice total (active, non-negative lines) minus non-deleted applied payments; aged from DueDate (falling back to invoice date)." It goes on to explain that an invoice with no payment recorded counts as fully outstanding, so you can tell real debt from payments nobody entered.
- Up to 2,000 rows per run, with a note to narrow the dates when a result reaches that cap
- Text cells that start with =, +, - or @ get a leading apostrophe in the CSV, so Excel never runs them as formulas
- Checks before a run: dates as YYYY-MM-DD, a To date after the From date (the To date itself is not included), and Top N from 1 to 100
Who sees what
Admins decide who can run which reports
Reports appears in the sidebar for users with the View reports permission, which company admins have by default and can grant to other roles in Settings > Users > Roles. The six revenue and receivables reports also need View Invoices and Payments, price vs cost needs access to expense data (Expenses tab - view existing data), and the other eleven are for administrators only. A report a user cannot run stays in the list with a lock, and its header says what access it needs.
- View reports opens the page, role by role
- Money reports also need invoice or expense access
- Locked reports say what access they need
Available today
Run the same reports today by asking the AI assistant
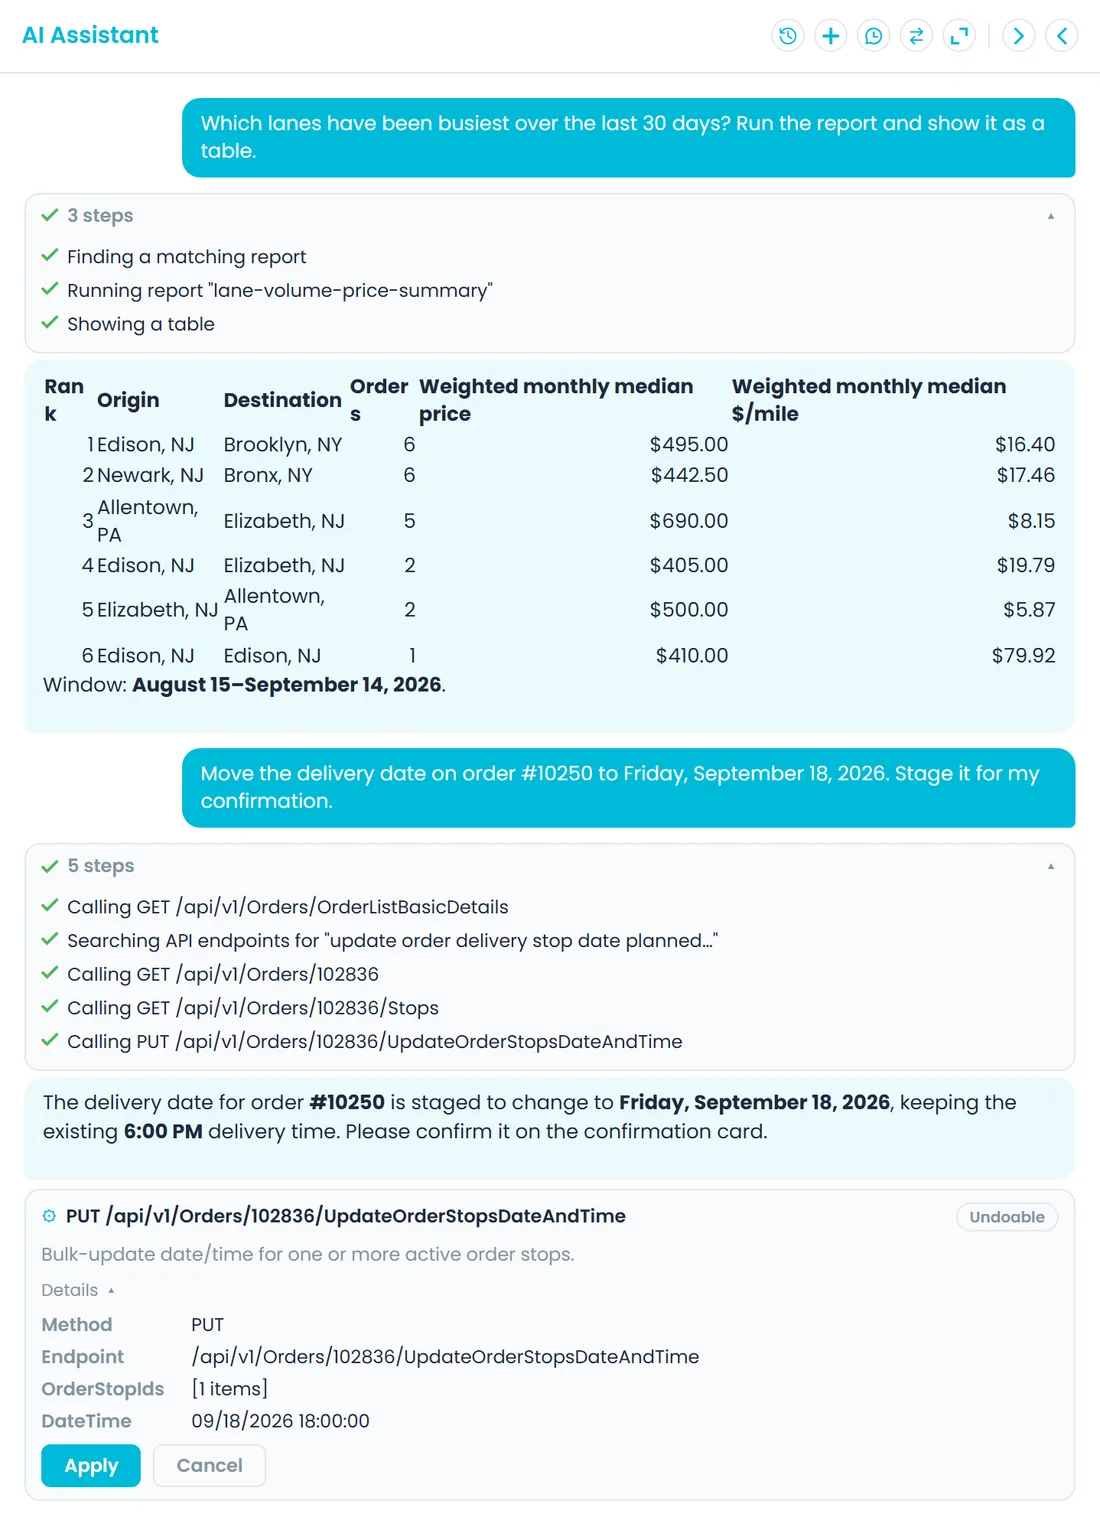
The Reports page is new, but the reports behind it are not. Today the AI assistant runs the same 18 reports when you ask, for example: "Which lanes have been busiest over the last 30 days? Run the report and show it as a table." It finds the matching report, runs it and answers with a table or a chart, and each report keeps the same access rule in chat: invoice access for the money reports, expense access for price vs cost, administrators for the rest.
- Ask in plain English or Hebrew
- Ask for the answer as a table or as a chart
- Money reports need the same invoice or expense access in chat
The reports, area by area
What each area covers, and who can run it
By default, company admins can run every report. Other roles need View reports to open the page, plus the access listed under each area.
Revenue
Invoiced revenue by month, top customers by invoiced revenue, accessorial revenue by charge type, and invoiced waiting time and detention by month. Needs View Invoices and Payments.
Receivables
AR aging in 0-30, 31-60, 61-90 and 90+ day buckets, and closed orders that were never invoiced, with their freight price. Needs View Invoices and Payments.
Operations
Orders counted by status, and completed stops per driver for the dates you pick. Administrators only.
Sales
New customers added per month, quote-to-order conversion by month (an estimate), and average order value by shipment type. Administrators only.
Pricing
Custom-priced orders by month, top lanes by volume with the weighted monthly median price and price per mile, and one customer's lane price history. Administrators only.
Costs
Expense totals by type and subtype, and driver and outsource payouts by payment status, for administrators only. Price vs cost lines by month needs Expenses tab - view existing data.
Why it helps the office
Every result states its basis
Under each result, a Basis note says what the numbers are built from, such as which invoice lines count as revenue and by which date, so a figure is not mistaken for something it is not.
Built from your own records
Reports read the orders, invoices, routes and expenses already in RushHour, instead of a spreadsheet someone rebuilds by hand.
No prompt to write
Once an admin grants View reports, billing and dispatch users run the reports their role allows from a page, without asking the AI assistant.
FAQ
Questions about the Reports page
When can we use the Reports page?
It is finished and in final testing, and it ships with the next production release. The same 18 reports already run today when you ask the AI assistant for them.
Can dispatchers and billing staff run reports?
Yes, the reports their role allows. A company admin grants View reports to their role in Settings > Users > Roles. The revenue and receivables reports also need View Invoices and Payments, price vs cost needs Expenses tab - view existing data, and the other 11 reports run for company admins only. Reports a role cannot run stay in the list with a lock.
Does the Reports page draw charts?
No. It shows each result as a table you can export to CSV. For a chart, ask the AI assistant to run the report and show it as a chart.
How much data can one report return?
Up to 2,000 rows per run, and up to 500 for the customer lane price history. When a result reaches 2,000 rows, the page says so and asks you to narrow the date range.
Will the CSV open properly in Excel?
Yes. The file is saved as UTF-8 with a byte order mark, so Excel shows Hebrew text correctly, and text cells that start with =, +, - or @ get a leading apostrophe so they never run as formulas.
Can I save a report with my dates and options?
Yes. After a run, the page address holds the report and any options you changed, so you can bookmark it or send it to a colleague. Opening the link fills in the form and runs the report again for anyone whose role can run it.
Do the revenue figures match the Dashboard?
They come from the same invoices: non-deleted invoices that count toward customer balances, active lines only, by invoice date. The one difference is credit lines. Invoiced revenue by month nets negative (credit) lines into each month, while the Dashboard revenue widget leaves them out, so a month with credits shows less in the report.
Related
Bring the spreadsheet you rebuild by hand.
Tell us which figures you pull together each month, and in the demo we will go through which of the 18 reports cover them.