Prove the program.
Find the next fix.
Safety only improves what gets measured. RushHour Reporting & Insights gives safety managers pre-built dashboards plus the flexibility to build the report you actually need.
Reports that actually get read
From raw events to executive summary
Pre-built reports
The reports you'd build anyway — already built
Driver scorecards, incident frequency, DVIR compliance, coaching follow-through. The standard set is one click away.
- Driver scorecard reports
- Incident frequency analysis
- DVIR compliance overview
Custom dashboards
Slice the data the way your org thinks about it
Terminal, vehicle class, driver tenure, dispatcher, customer — build a dashboard for each stakeholder so the safety org and ops org work from the same data.
- Drag-and-drop dashboards
- Saved views per role
- Scheduled email exports
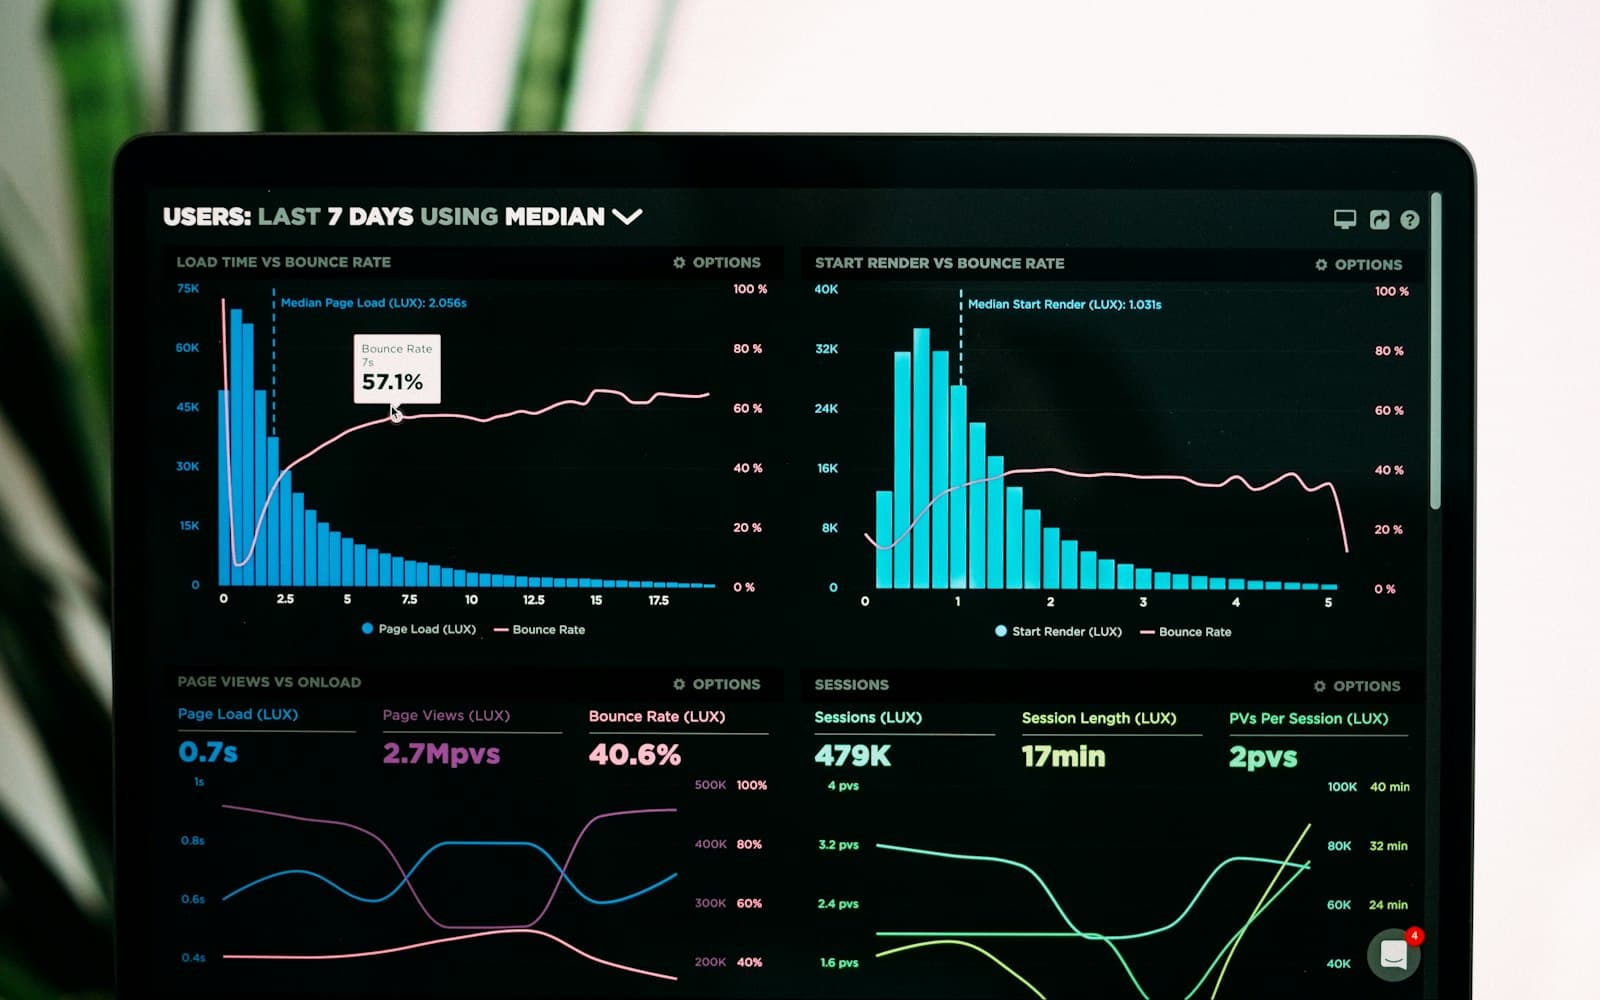
What you'll measure
Driver-level trends
Score over time, coaching follow-through, retention correlation.
Event volume
Harsh events by day, terminal, route type.
DVIR compliance
Completion rates, defect frequency, time-to-resolution.
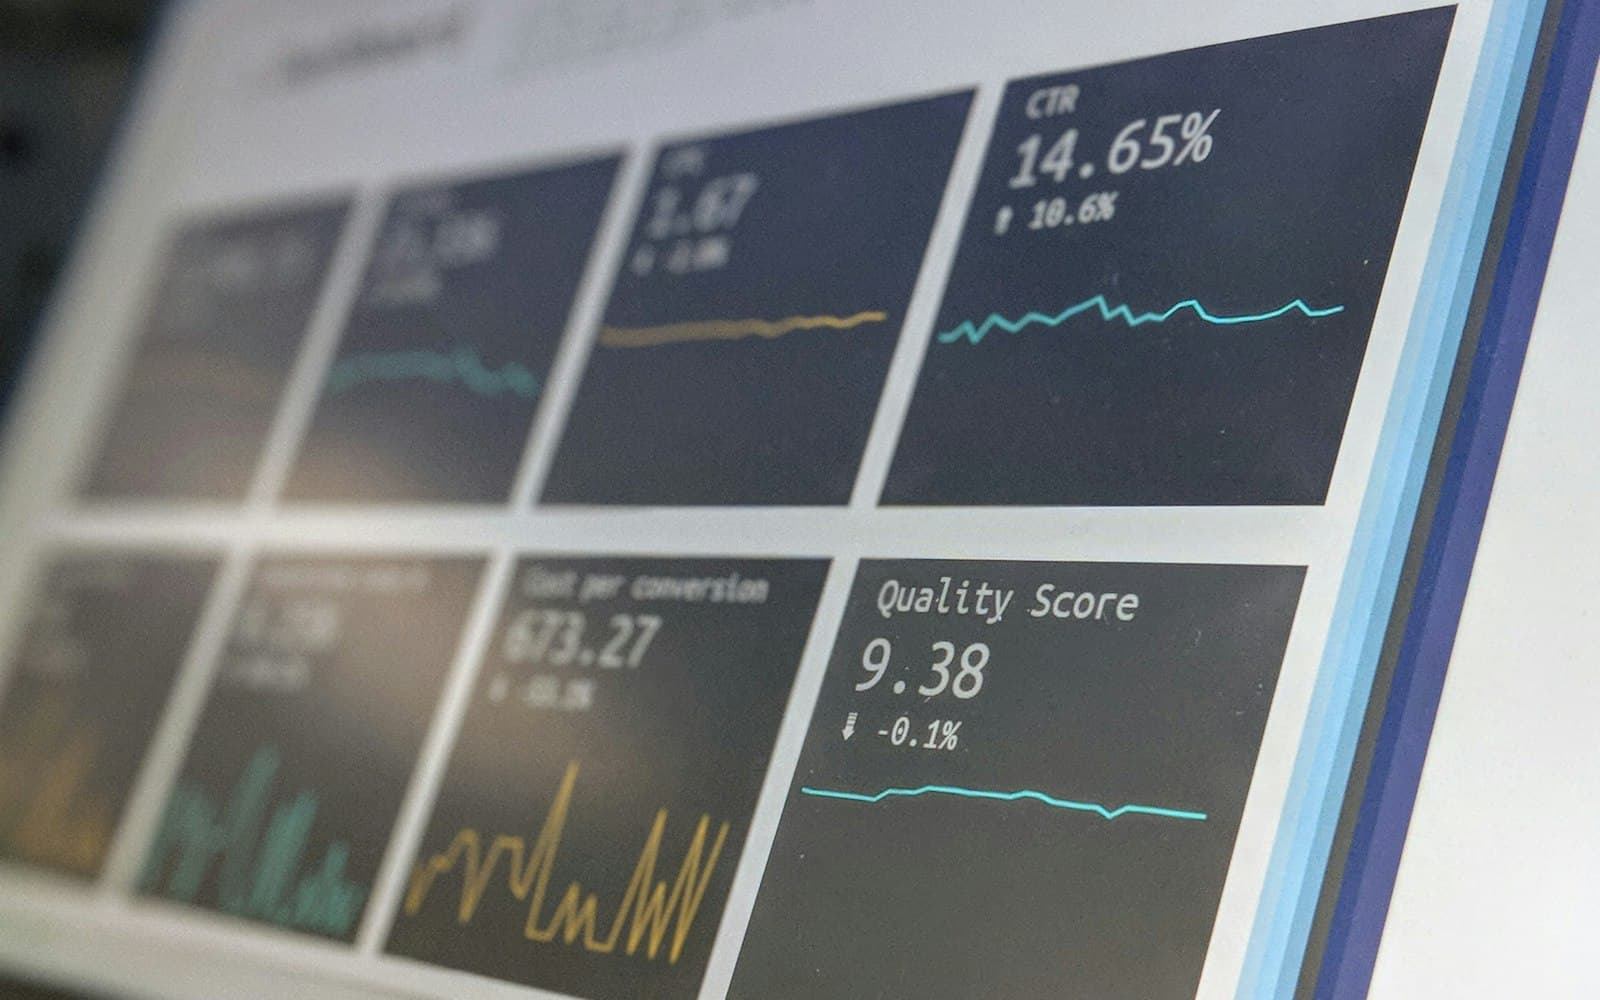
Program ROI
Insurance impact, incident cost trends, claim frequency.
What's the one report you wish you had?
Tell us in the demo — we'll build it live.